
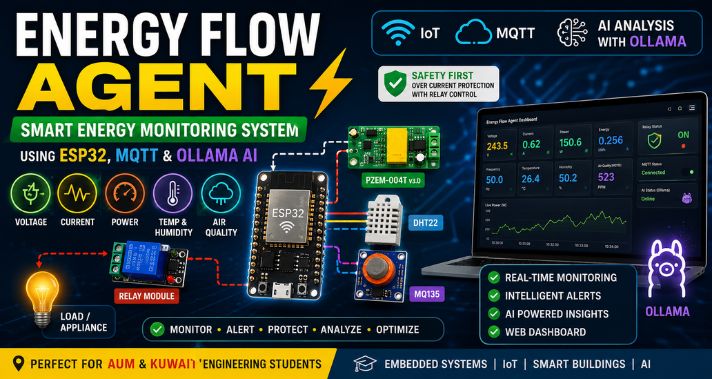
Electricity is one of those most vital aspects of our lives today. Everyday, electricity is required to power homes, offices, stores, labs, classrooms and commercial buildings. However, if not monitored properly, electricity can cost the consumer more than they expected, cause unsafe wiring conditions, damage equipment, create fire hazards and cause energy wastage. Smart energy monitoring is of particular benefit in a hot country such as Kuwait where the buildings are largely reliant on air conditioning, lighting, appliances, and electronic devices.
What Is Energy Flow Agent?
Energy Flow Agent is an IoT smart building energy monitoring system. It has an ESP32 microcontroller as its primary controller. The ESP32 reads data from various sensors, and writes to an MQTT topic. The Flask bridge server receives the MQTT data, updates a web dashboard and can also send to a local AI model using Ollama to provide intelligent feedback.
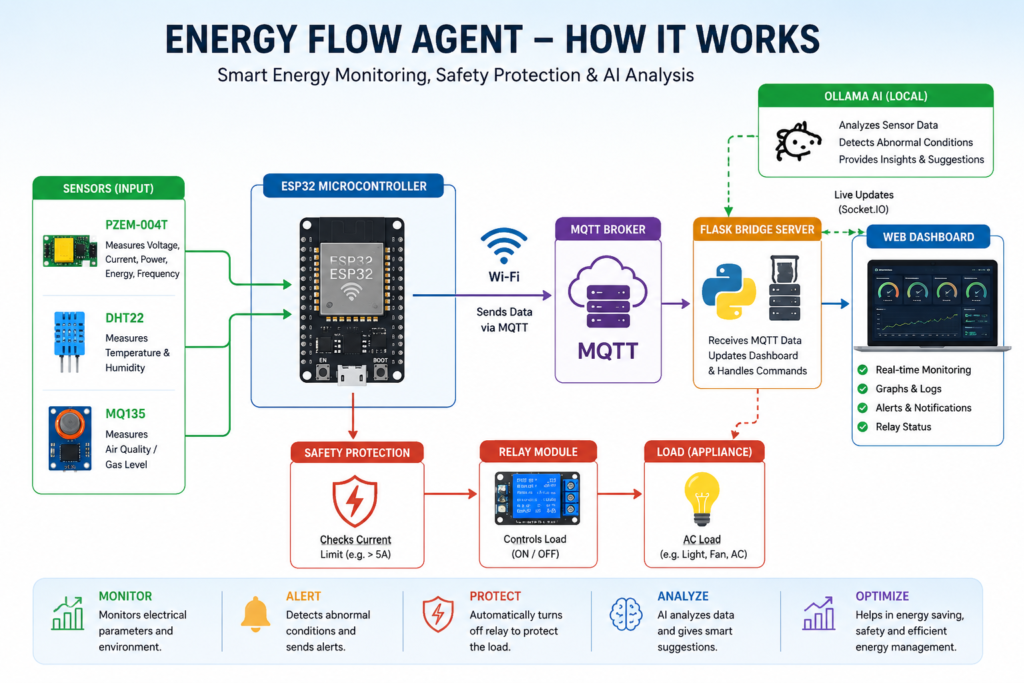
The term ‘Energy Flow’ indicates that the system will monitor the movement of electrical energy through a load. It monitors available voltage, current consumption, power usage and the time-varying power consumption. The term “Agent” indicates that the system is not just displaying numbers but offering the user insights into what is occurring by providing alerts and suggestions.
If the current exceeds the limit, the ESP32 can turn off the relay to safeguard the load, for instance. When the MQ135 sensor detects poor air quality, it can display a warning on the dashboard. In case of high temperature the system can alert the user. These readings can be explained to a layman with the feature of Ollama integration.
Why This Project Is Important in Kuwait?
There are various residential and commercial buildings in Kuwait where the electrical devices operate at all times. Air conditioning, lighting, computers, lab equipment, appliances, and industrial loads can consume significant energy. Without energy monitoring, it is difficult for users to realize when electricity is being wasted or when it is being used in an unsafe condition.
With such a smart monitoring system, users can get real-time energy values. The user can get real-time voltage, current, power, energy, and frequency data rather than waiting for a monthly electricity bill. This can assist students, homeowners, building managers and small businesses to better grasp power usage.
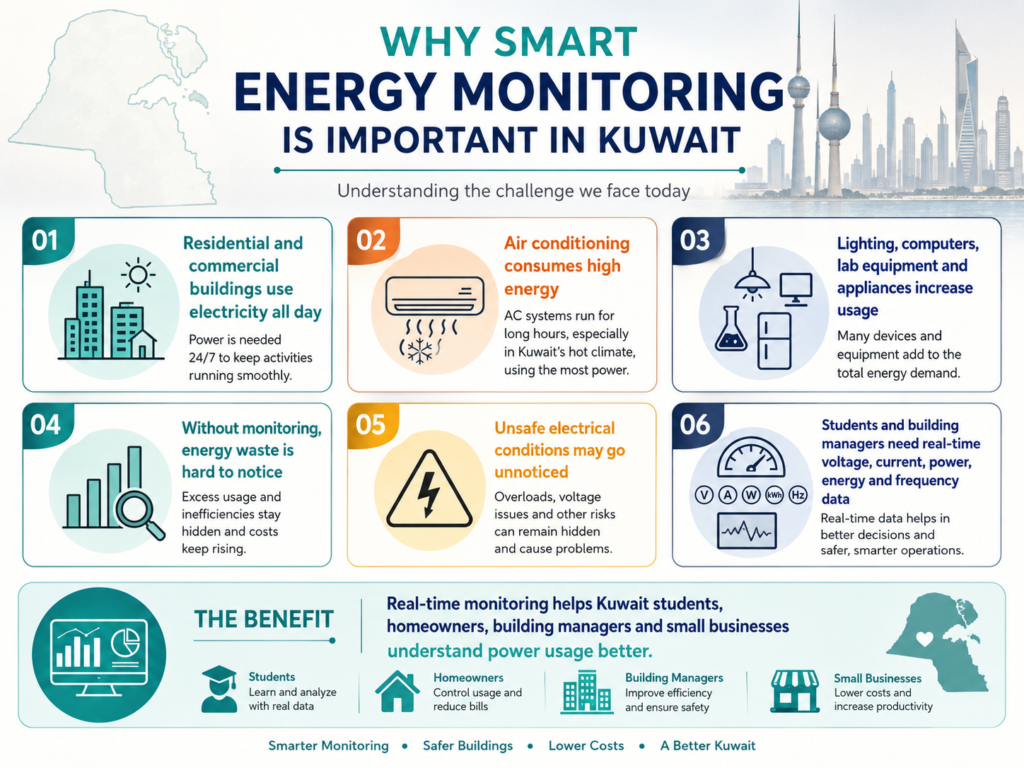
This project is also useful for the Kuwait engineering students as it is a combination of real electrical sensing, IoT communication, cloud development or a local dashboard, automation and AI data analysis. AUM students working on senior design or embedded systems projects can learn how hardware, software, networking, and intelligent feedback work together in one complete system.
Main Aim of the Project
The main aim of this project is to design a smart, low-cost, and user-friendly energy monitoring system for buildings. The system should be able to monitor electrical and environmental parameters, detect abnormal conditions, and provide useful feedback to the user.
The project focuses on these main objectives:
- Measure voltage, current, power, energy, and frequency using PZEM-004T.
- Measure temperature and humidity using DHT22.
- Measure air quality using MQ135.
- Send sensor data from ESP32 to MQTT.
- Display real-time values on a Flask web dashboard.
- Use Socket.IO for live dashboard updates.
- Use relay control for overcurrent protection.
- Use Ollama AI to explain readings and provide suggestions.
- Help users understand energy safety and efficiency.
- Provide a practical academic project for Kuwait and AUM students.
Components Used in the Project
The system uses both hardware and software components. Each component has a specific role.
Hardware Components
| Component | Purpose |
|---|---|
| ESP32 | Main microcontroller with Wi-Fi |
| PZEM-004T v3.0 | Measures voltage, current, power, energy, and frequency |
| DHT22 | Measures temperature and humidity |
| MQ135 | Measures air quality or gas level |
| Relay Module | Controls the load based on unsafe current condition |
| Electrical Load | Example load such as bulb or appliance |
| Breadboard and Wires | Used for prototyping |
| Power Supply | Powers the ESP32 and modules |
Software Components
| Software | Purpose |
|---|---|
| Arduino IDE | Used to program ESP32 |
| MQTT Broker | Receives sensor data from ESP32 |
| PubSubClient | MQTT library for ESP32 |
| Flask | Python web server |
| Flask-SocketIO | Real-time web updates |
| Paho-MQTT | Python MQTT client |
| Ollama | Local AI model for analysis |
| Web Dashboard | Displays readings, graphs, and alerts |
Connection Diagram
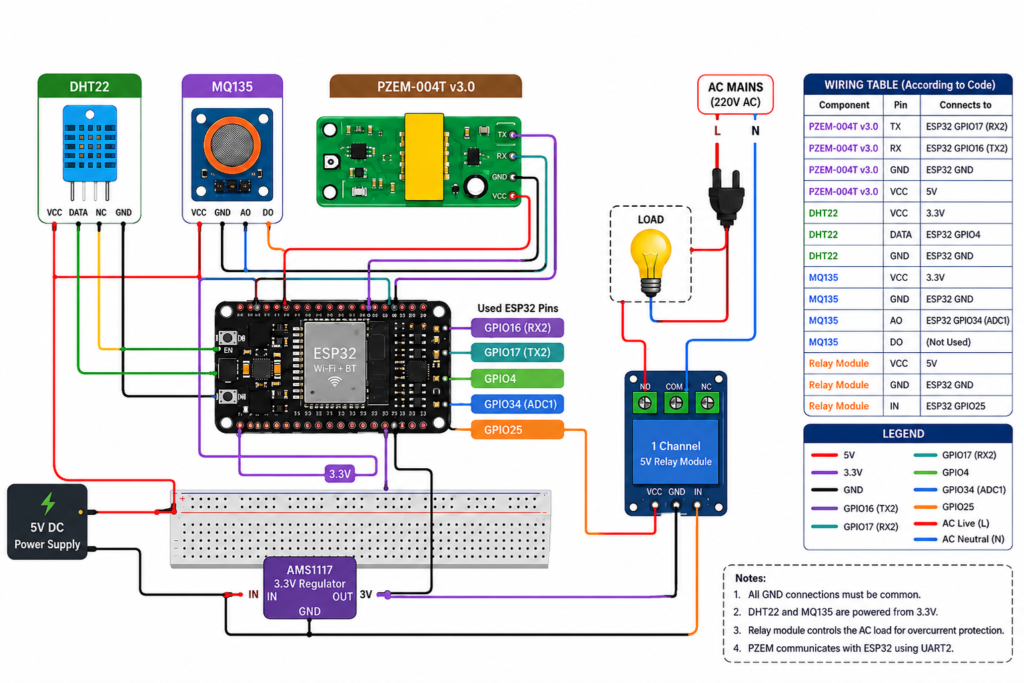
The connection diagram shows the wiring of the components in the Energy Flow Agent with the ESP32 microcontroller. The voltage, current, power, energy, and frequency are measured in this system using the UART pins of the ESP32, the PZEM-004T energy meter. The DHT22 sensor is connected to GPIO4 to read the temperature and humidity, and the MQ135 gas sensor is connected to GPIO34 as analog input to monitor air quality.
The relay module is connected to GPIO25 and can be used to turn on/off an electrical load in case of adverse conditions, such as overcurrent. For students of engineering in Kuwait and AUM, this diagram is of great help to see how sensors, power lines, common ground, and relay control are arranged in a practical energy monitoring project using the ESP32.
| ESP32 Pin | Connected Component |
|---|---|
| GPIO16 | PZEM RX/TX communication line |
| GPIO17 | PZEM TX/RX communication line |
| GPIO4 | DHT22 data pin |
| GPIO34 | MQ135 analog output |
| GPIO25 | Relay signal pin |
| 3.3V / 5V | Sensor/module power according to module requirement |
| GND | Common ground |
Important wiring notes:
- All grounds must be connected together.
- DHT22 should have correct power and data connection.
- MQ135 analog output should go to GPIO34.
- PZEM communication must use the correct RX and TX crossing.
- Relay module wiring must be tested before connecting a real load.
- AC mains wiring should only be done with proper safety supervision.
Complete Code
The complete code for ESP32 and web dashboard are shown below:
ESP32 Code
#include <WiFi.h>
#include <PubSubClient.h>
#include <PZEM004Tv30.h>
#include <DHT.h>

#define WIFI_SSID "HUAWEI_H112_DEA2"
#define WIFI_PASS "17ARQN13NFE"

#define MQTT_SERVER "192.168.8.135"
#define MQTT_PORT 1883
#define MQTT_TOPIC "home/energy_monitor/data"

#define PZEM_RX 16
#define PZEM_TX 17
PZEM004Tv30 pzem(&Serial2, PZEM_RX, PZEM_TX);

#define DHTPIN 4
#define DHTTYPE DHT22
DHT dht(DHTPIN, DHTTYPE);

#define MQ135_PIN 34
#define RELAY_PIN 25

WiFiClient espClient;
PubSubClient client(espClient);

float voltage, current, power, energy, frequency;
float temperature, humidity;
int mq135_value = 0;

unsigned long previousMillis = 0;
const long interval = 2000;

void connectWiFi() {
  WiFi.begin(WIFI_SSID, WIFI_PASS);
  while (WiFi.status() != WL_CONNECTED) {
    delay(500);
  }
}

void connectMQTT() {
  while (!client.connected()) {
    String clientId = "ESP32EnergyMonitor-";
    clientId += String(random(0xffff), HEX);
    if (client.connect(clientId.c_str())) {
    } else {
      delay(2000);
    }
  }
}

void setup() {
  Serial.begin(115200);
  Serial2.begin(9600, SERIAL_8N1, PZEM_RX, PZEM_TX);
  dht.begin();

  pinMode(RELAY_PIN, OUTPUT);
  digitalWrite(RELAY_PIN, HIGH);

  connectWiFi();
  client.setServer(MQTT_SERVER, MQTT_PORT);
}

void loop() {
  if (!client.connected()) {
    connectMQTT();
  }
  client.loop();

  unsigned long currentMillis = millis();
  if (currentMillis - previousMillis >= interval) {
    previousMillis = currentMillis;

    voltage   = pzem.voltage();
    current   = pzem.current();
    power     = pzem.power();
    energy    = pzem.energy();
    frequency = pzem.frequency();

    temperature = dht.readTemperature();
    humidity    = dht.readHumidity();
    mq135_value = analogRead(MQ135_PIN);

    if (current > 5.0) {
      digitalWrite(RELAY_PIN, LOW);
    } else {
      digitalWrite(RELAY_PIN, HIGH);
    }

    float safeVoltage = voltage >= 0 ? voltage : 0;
    float safeCurrent = current >= 0 ? current : 0;
    float safePower = power >= 0 ? power : 0;
    float safeEnergy = energy >= 0 ? energy : 0;
    float safeFrequency = frequency >= 0 ? frequency : 0;
    float safeTemp = !isnan(temperature) ? temperature : 0;
    float safeHum = !isnan(humidity) ? humidity : 0;
    String relayState = digitalRead(RELAY_PIN) ? "ON" : "OFF";

    String payload = "{";
    payload += "\"voltage\":" + String(safeVoltage, 2) + ",";
    payload += "\"current\":" + String(safeCurrent, 2) + ",";
    payload += "\"power\":" + String(safePower, 2) + ",";
    payload += "\"energy\":" + String(safeEnergy, 3) + ",";
    payload += "\"frequency\":" + String(safeFrequency, 2) + ",";
    payload += "\"temperature\":" + String(safeTemp, 2) + ",";
    payload += "\"humidity\":" + String(safeHum, 2) + ",";
    payload += "\"mq135\":" + String(mq135_value) + ",";
    payload += "\"relay\":\"" + relayState + "\"";
    payload += "}";

    client.publish(MQTT_TOPIC, payload.c_str());

    Serial.println(payload);
  }
}
Web Dashboard
"""
ESP32 × Ollama — Flask Bridge Server
=====================================
Auto-discovers MQTT broker on your LAN, subscribes to all ESP32 sensor
readings, and serves the dashboard at http://localhost:5000

Install dependencies:
    pip install flask flask-socketio paho-mqtt requests eventlet

Run:
    python flask_bridge.py
"""

import os
import sys
import json
import time
import socket
import threading
import subprocess
import webbrowser
import ipaddress
from datetime import datetime
from concurrent.futures import ThreadPoolExecutor, as_completed

import requests
import paho.mqtt.client as mqtt
from flask import Flask, render_template_string, jsonify, request, Response
from flask_socketio import SocketIO, emit

# ═══════════════════════════════════════════════════════
#  CONFIG — change these if auto-detect fails
# ═══════════════════════════════════════════════════════
MQTT_PORT       = 1883
MQTT_WS_PORT    = 9001
MQTT_TOPIC      = "home/energy_monitor/data"
MQTT_CMD_TOPIC  = "home/energy_monitor/cmd"
OLLAMA_URL      = "http://localhost:11434"
FLASK_PORT      = 5000
AUTO_OPEN_BROWSER = True
SCAN_TIMEOUT    = 0.35   # seconds per host probe

# ═══════════════════════════════════════════════════════
#  FLASK + SOCKETIO SETUP
# ═══════════════════════════════════════════════════════
app = Flask(__name__)
app.config["SECRET_KEY"] = "esp32-energy-key-2025"
socketio = SocketIO(app, cors_allowed_origins="*", async_mode="eventlet")

# ═══════════════════════════════════════════════════════
#  SHARED STATE
# ═══════════════════════════════════════════════════════
state = {
    "mqtt_broker_ip": None,
    "mqtt_connected": False,
    "ollama_available": False,
    "ollama_models": [],
    "local_ip": None,
    "last_payload": {},
    "last_seen": None,
    "packet_count": 0,
    "relay_state": "ON",
    "log": [],
}

mqtt_client = None
lock = threading.Lock()


# ═══════════════════════════════════════════════════════
#  UTILITIES
# ═══════════════════════════════════════════════════════
def ts():
    return datetime.now().strftime("%H:%M:%S")


def add_log(level, msg):
    entry = {"ts": ts(), "level": level, "msg": msg}
    with lock:
        state["log"].insert(0, entry)
        if len(state["log"]) > 200:
            state["log"].pop()
    socketio.emit("log", entry)
    icon = {"INFO": "ℹ", "OK": "✅", "WARN": "⚠", "ERR": "❌", "MQTT": "📡", "SENSOR": "⚡"}
    print(f"[{ts()}] {icon.get(level,'·')} {msg}")


def get_local_ip():
    """Get this machine's LAN IP by connecting to a known host."""
    try:
        s = socket.socket(socket.AF_INET, socket.SOCK_DGRAM)
        s.connect(("8.8.8.8", 80))
        ip = s.getsockname()[0]
        s.close()
        return ip
    except Exception:
        return "127.0.0.1"


# ═══════════════════════════════════════════════════════
#  AUTO-DETECT MQTT BROKER
# ═══════════════════════════════════════════════════════
def probe_mqtt(ip, port, timeout):
    """Return True if port is open on ip."""
    try:
        with socket.create_connection((ip, port), timeout=timeout):
            return True
    except Exception:
        return False


def scan_network_for_mqtt(base_ip, port=MQTT_PORT, timeout=SCAN_TIMEOUT):
    """
    Scan the /24 subnet of base_ip for an open MQTT port.
    Returns the first IP found, or None.
    """
    try:
        network = ipaddress.IPv4Network(f"{base_ip}/24", strict=False)
    except Exception:
        return None

    hosts = [str(h) for h in network.hosts() if str(h) != base_ip]
    add_log("INFO", f"Scanning {len(hosts)} hosts on {network} for port {port}…")

    # Check localhost first (broker might be on this machine)
    if probe_mqtt("127.0.0.1", port, timeout):
        add_log("OK", "MQTT broker found on localhost!")
        return "127.0.0.1"

    with ThreadPoolExecutor(max_workers=64) as pool:
        futures = {pool.submit(probe_mqtt, ip, port, timeout): ip for ip in hosts}
        for future in as_completed(futures):
            ip = futures[future]
            try:
                if future.result():
                    add_log("OK", f"MQTT broker found at {ip}:{port}")
                    return ip
            except Exception:
                pass
    return None


def auto_discover_mqtt():
    """Full discovery flow — scan LAN, then connect."""
    global mqtt_client

    local_ip = get_local_ip()
    with lock:
        state["local_ip"] = local_ip
    add_log("INFO", f"Local IP: {local_ip}")

    # Try known IPs first (from .ino file)
    known = ["192.168.8.135", "192.168.1.1", "192.168.0.1", "10.0.0.1"]
    broker_ip = None
    for ip in known:
        add_log("INFO", f"Probing known IP {ip}:{MQTT_PORT}…")
        if probe_mqtt(ip, MQTT_PORT, timeout=0.6):
            broker_ip = ip
            add_log("OK", f"Found broker at known IP {ip}")
            break

    # Full subnet scan if known IPs failed
    if not broker_ip:
        broker_ip = scan_network_for_mqtt(local_ip, MQTT_PORT)

    if not broker_ip:
        add_log("WARN", "No MQTT broker found on LAN. Retrying in 30s…")
        threading.Timer(30, auto_discover_mqtt).start()
        return

    with lock:
        state["mqtt_broker_ip"] = broker_ip

    connect_mqtt(broker_ip)


# ═══════════════════════════════════════════════════════
#  MQTT CLIENT
# ═══════════════════════════════════════════════════════
def on_connect(client, userdata, flags, rc):
    if rc == 0:
        client.subscribe(MQTT_TOPIC)
        client.subscribe(MQTT_CMD_TOPIC)
        with lock:
            state["mqtt_connected"] = True
        add_log("OK", f"MQTT connected → subscribed to {MQTT_TOPIC}")
        socketio.emit("mqtt_status", {"connected": True, "broker": state["mqtt_broker_ip"]})
    else:
        codes = {1:"bad protocol",2:"bad client id",3:"server unavailable",4:"bad credentials",5:"not authorised"}
        add_log("ERR", f"MQTT connect failed: {codes.get(rc, f'rc={rc}')}")


def on_disconnect(client, userdata, rc):
    with lock:
        state["mqtt_connected"] = False
    add_log("WARN", "MQTT disconnected — will reconnect automatically")
    socketio.emit("mqtt_status", {"connected": False})


def on_message(client, userdata, msg):
    """Parse ESP32 JSON payload and push to all dashboard clients."""
    try:
        raw = msg.payload.decode("utf-8")
        data = json.loads(raw)

        # Normalise all 8 fields from the .ino exactly
        payload = {
            "voltage":     float(data.get("voltage", 0)),
            "current":     float(data.get("current", 0)),
            "power":       float(data.get("power", data.get("voltage", 0) * data.get("current", 0))),
            "energy":      float(data.get("energy", 0)),
            "frequency":   float(data.get("frequency", 0)),
            "temperature": float(data.get("temperature", 0)),
            "humidity":    float(data.get("humidity", 0)),
            "mq135":       int(data.get("mq135", 0)),
            "relay":       str(data.get("relay", "ON")),
            "ts":          ts(),
            "source":      "live",
        }

        with lock:
            state["last_payload"] = payload
            state["last_seen"] = ts()
            state["packet_count"] += 1
            state["relay_state"] = payload["relay"]
            count = state["packet_count"]

        # Push sensor data to all connected browsers
        socketio.emit("sensor_data", payload)

        if count % 10 == 0:
            add_log("SENSOR", f"#{count} V={payload['voltage']:.1f}V "
                              f"A={payload['current']:.2f}A "
                              f"T={payload['temperature']:.1f}°C "
                              f"MQ={payload['mq135']}")
    except json.JSONDecodeError as e:
        add_log("WARN", f"JSON parse error: {e} — raw: {msg.payload[:60]}")
    except Exception as e:
        add_log("ERR", f"Message handler error: {e}")


def connect_mqtt(broker_ip):
    global mqtt_client
    add_log("MQTT", f"Connecting to broker at {broker_ip}:{MQTT_PORT}…")

    client = mqtt.Client(client_id=f"flask-bridge-{int(time.time())}")
    client.on_connect    = on_connect
    client.on_disconnect = on_disconnect
    client.on_message    = on_message

    try:
        client.connect(broker_ip, MQTT_PORT, keepalive=60)
        client.loop_start()
        mqtt_client = client
        add_log("MQTT", "MQTT client started (background loop)")
    except Exception as e:
        add_log("ERR", f"MQTT connect failed: {e}")
        add_log("INFO", "Retrying in 10s…")
        threading.Timer(10, lambda: connect_mqtt(broker_ip)).start()


# ═══════════════════════════════════════════════════════
#  OLLAMA HEALTH CHECK
# ═══════════════════════════════════════════════════════
def check_ollama():
    try:
        r = requests.get(f"{OLLAMA_URL}/api/tags", timeout=3)
        if r.status_code == 200:
            models = [m["name"] for m in r.json().get("models", [])]
            with lock:
                state["ollama_available"] = True
                state["ollama_models"] = models
            add_log("OK", f"Ollama online — models: {', '.join(models) or 'none'}")
            socketio.emit("ollama_status", {"available": True, "models": models})
        else:
            raise Exception(f"HTTP {r.status_code}")
    except Exception as e:
        with lock:
            state["ollama_available"] = False
        add_log("WARN", f"Ollama not reachable: {e}")
        socketio.emit("ollama_status", {"available": False, "models": []})


def ollama_health_loop():
    while True:
        check_ollama()
        time.sleep(30)


# ═══════════════════════════════════════════════════════
#  FLASK ROUTES
# ═══════════════════════════════════════════════════════
@app.route("/")
def index():
    """Serve the main dashboard."""
    dash_path = os.path.join(os.path.dirname(__file__), "esp32_ollama_dashboard.html")
    if os.path.exists(dash_path):
        with open(dash_path, "r", encoding="utf-8") as f:
            html = f.read()
        return html
    return "<h2>Dashboard HTML not found. Place esp32_ollama_dashboard.html next to flask_bridge.py</h2>", 404


@app.route("/api/status")
def api_status():
    """Full system status JSON."""
    with lock:
        return jsonify({
            "bridge": {
                "local_ip":      state["local_ip"],
                "flask_port":    FLASK_PORT,
                "uptime":        ts(),
            },
            "mqtt": {
                "connected":     state["mqtt_connected"],
                "broker_ip":     state["mqtt_broker_ip"],
                "broker_port":   MQTT_PORT,
                "ws_port":       MQTT_WS_PORT,
                "topic":         MQTT_TOPIC,
                "packet_count":  state["packet_count"],
                "last_seen":     state["last_seen"],
            },
            "sensors": state["last_payload"],
            "ollama": {
                "available":     state["ollama_available"],
                "url":           OLLAMA_URL,
                "models":        state["ollama_models"],
            },
            "relay": state["relay_state"],
        })


@app.route("/api/sensors")
def api_sensors():
    """Latest sensor reading only."""
    with lock:
        if not state["last_payload"]:
            return jsonify({"error": "No data yet", "mqtt_connected": state["mqtt_connected"]}), 503
        return jsonify(state["last_payload"])


@app.route("/api/relay", methods=["POST"])
def api_relay():
    """
    Send relay command to ESP32 via MQTT.
    POST JSON: {"state": "ON"} | {"state": "OFF"} | {"state": "AUTO"}
    """
    global mqtt_client
    body = request.get_json(silent=True) or {}
    cmd = body.get("state", "AUTO").upper()
    if cmd not in ("ON", "OFF", "AUTO"):
        return jsonify({"error": "state must be ON, OFF or AUTO"}), 400

    if mqtt_client and state["mqtt_connected"]:
        payload = json.dumps({"relay": cmd})
        mqtt_client.publish(MQTT_CMD_TOPIC, payload)
        add_log("OK", f"Relay command sent: {cmd}")
        return jsonify({"ok": True, "command": cmd})
    else:
        return jsonify({"error": "MQTT not connected"}), 503


@app.route("/api/log")
def api_log():
    """Last 100 log entries."""
    with lock:
        return jsonify(state["log"][:100])


@app.route("/api/scan", methods=["POST"])
def api_scan():
    """Trigger a fresh network scan for the MQTT broker."""
    threading.Thread(target=auto_discover_mqtt, daemon=True).start()
    return jsonify({"ok": True, "msg": "Network scan started — check /api/status"})


@app.route("/api/ollama/proxy", methods=["POST"])
def ollama_proxy():
    """
    Proxy Ollama API calls from the dashboard to avoid CORS issues.
    POST body forwarded to Ollama /api/chat
    """
    try:
        body = request.get_json()
        r = requests.post(
            f"{OLLAMA_URL}/api/chat",
            json=body,
            stream=True,
            timeout=120,
        )

        def generate():
            for chunk in r.iter_content(chunk_size=None):
                if chunk:
                    yield chunk

        return Response(
            generate(),
            status=r.status_code,
            content_type=r.headers.get("Content-Type", "application/x-ndjson"),
        )
    except Exception as e:
        return jsonify({"error": str(e)}), 502


@app.route("/api/config")
def api_config():
    """
    Returns auto-detected config values that the dashboard JS can use
    to pre-fill its connection fields.
    """
    with lock:
        broker = state["mqtt_broker_ip"] or "not-detected"
        return jsonify({
            "mqtt_ws_url":    f"ws://{broker}:{MQTT_WS_PORT}",
            "mqtt_topic":     MQTT_TOPIC,
            "ollama_url":     OLLAMA_URL,
            "ollama_model":   state["ollama_models"][0] if state["ollama_models"] else "llama3.2",
            "broker_ip":      broker,
            "local_ip":       state["local_ip"],
        })


# ═══════════════════════════════════════════════════════
#  SOCKET.IO EVENTS
# ═══════════════════════════════════════════════════════
@socketio.on("connect")
def on_ws_connect():
    add_log("INFO", f"Dashboard client connected: {request.sid}")
    # Send current state immediately on connect
    with lock:
        emit("mqtt_status", {
            "connected": state["mqtt_connected"],
            "broker":    state["mqtt_broker_ip"],
        })
        emit("ollama_status", {
            "available": state["ollama_available"],
            "models":    state["ollama_models"],
        })
        if state["last_payload"]:
            emit("sensor_data", state["last_payload"])


@socketio.on("disconnect")
def on_ws_disconnect():
    add_log("INFO", f"Dashboard client disconnected: {request.sid}")


@socketio.on("relay_cmd")
def on_relay_cmd(data):
    """Browser sends relay command through WebSocket."""
    cmd = data.get("state", "AUTO").upper()
    if mqtt_client and state["mqtt_connected"]:
        mqtt_client.publish(MQTT_CMD_TOPIC, json.dumps({"relay": cmd}))
        add_log("OK", f"Relay WS command: {cmd}")
        emit("relay_ack", {"ok": True, "state": cmd})
    else:
        emit("relay_ack", {"ok": False, "error": "MQTT not connected"})


# ═══════════════════════════════════════════════════════
#  STARTUP BANNER
# ═══════════════════════════════════════════════════════
def print_banner(local_ip):
    banner = f"""
╔══════════════════════════════════════════════════════════════╗
║        ESP32 × Ollama — Flask Bridge Server                  ║
╠══════════════════════════════════════════════════════════════╣
║  Dashboard  →  http://localhost:{FLASK_PORT:<28}    ║
║  LAN access →  http://{local_ip}:{FLASK_PORT:<28}    ║
║                                                              ║
║  REST API endpoints:                                         ║
║    GET  /api/status     — full system status JSON            ║
║    GET  /api/sensors    — latest ESP32 readings              ║
║    POST /api/relay      — send relay ON/OFF/AUTO             ║
║    POST /api/scan       — re-scan network for broker         ║
║    GET  /api/config     — auto-detected config values        ║
║    POST /api/ollama/proxy — CORS-free Ollama proxy           ║
║    GET  /api/log        — server log entries                 ║
║                                                              ║
║  WebSocket events (Socket.IO):                               ║
║    sensor_data  — real-time ESP32 readings                   ║
║    mqtt_status  — MQTT connect/disconnect events             ║
║    ollama_status — Ollama availability                       ║
║    relay_cmd    — send relay command from browser            ║
╚══════════════════════════════════════════════════════════════╝
"""
    print(banner)

# ═══════════════════════════════════════════════════════
#  MAIN
# ═══════════════════════════════════════════════════════
if __name__ == "__main__":
    local_ip = get_local_ip()
    with lock:
        state["local_ip"] = local_ip

    print_banner(local_ip)

    # 1. Background: auto-discover MQTT broker
    threading.Thread(target=auto_discover_mqtt, daemon=True).start()

    # 2. Background: Ollama health monitor
    threading.Thread(target=ollama_health_loop, daemon=True).start()

    # 3. Auto-open browser after 1.5s
    if AUTO_OPEN_BROWSER:
        def open_browser():
            time.sleep(1.5)
            webbrowser.open(f"http://localhost:{FLASK_PORT}")
        threading.Thread(target=open_browser, daemon=True).start()

    # 4. Start Flask-SocketIO
    add_log("OK", f"Flask bridge starting on http://0.0.0.0:{FLASK_PORT}")
    socketio.run(app, host="0.0.0.0", port=FLASK_PORT, debug=False)
How the System Works
The working process is simple but powerful. ESP32 will first connect to Wi-Fi. Upon successful Wi-Fi connection, it is connected to an MQTT broker. Every two seconds the ESP32 reads values from the PZEM-004T, DHT22 and MQ135 sensors.
The PZEM-004T provides electrical measurements like voltage, current, power, energy, and frequency. The DHT22 gives temperature and humidity values. The MQ135 provides an analog output which correlates to air quality. Once the values have been gathered, the ESP32 will check if the current exceeds the safety limit. The safety limit in the “shared code” is 5 A. If the current exceeds 5 A, the state of the relay will switch and protect the load.
Subsequently, the ESP32 forms a JSON payload. This payload contains the status of the relays and all the sensor readings. The data is published to the MQTT. The Flask bridge server is subscribed to this MQTT topic. As data comes in, the Flask server receives it and pushes it to the dashboard via Socket.IO. Live Sensor values along with graphs, logs and status of the system are shown on the dashboard. The Flask app also verifies if Ollama is available. Local AI analysis can be used on the dashboard to interpret the sensor data and offer suggestions when Ollama is running.
Ollama AI Integration
The most interesting component of this project is the use of Ollama. Ollama enables the system to serve a local AI model on the computer. The advantage of local AI is that these data will not be sent to an external cloud service for analysis.
Ollama is used in this project to explain the sensor readings in simple way. If the current is high, for instance, the AI can explain the system may be overloaded. If MQ135 values are high, it can recommend improving ventilation. If the voltage is not within normal limits, it may indicate a problem with the power supply or with the electrical connections.
This helps to make the system easier to use. Rather than just displaying raw data, the dashboard can offer meaningful suggestions. This is beneficial for non-technical users that might not be completely familiar with the concepts of voltage, current, power, or air quality readings. The project is a good choice for the AUM students as it involves both embedded systems and local AI. It’s not just an IoT project but an intelligent monitoring system.
Dashboard Features
The dashboard is the main user interface of the project. It displays real-time energy and environment values in a simple way. A good dashboard is important because users should understand system conditions quickly.
The dashboard can show:
- voltage
- current
- power
- energy
- frequency
- temperature
- humidity
- MQ135 air quality value
- relay status
- MQTT connection status
- Ollama connection status
- graphs
- warning messages
- critical alerts
- event logs
The dashboard also helps compare readings over time. For example, if current suddenly increases, the graph can show the change clearly. If air quality becomes poor, the dashboard can display warning labels. If the relay trips, the dashboard can show relay status.
Results and Testing
The project was subjected to various tests. During normal operation, the dashboard displayed stable readings and no significant warning messages. During the tests, the PZEM sensor was attached and had a voltage of approximately 240-243 V, and frequency of approximately 50 Hz. This demonstrated the energy meter’s capability of detecting the electrical supply values.
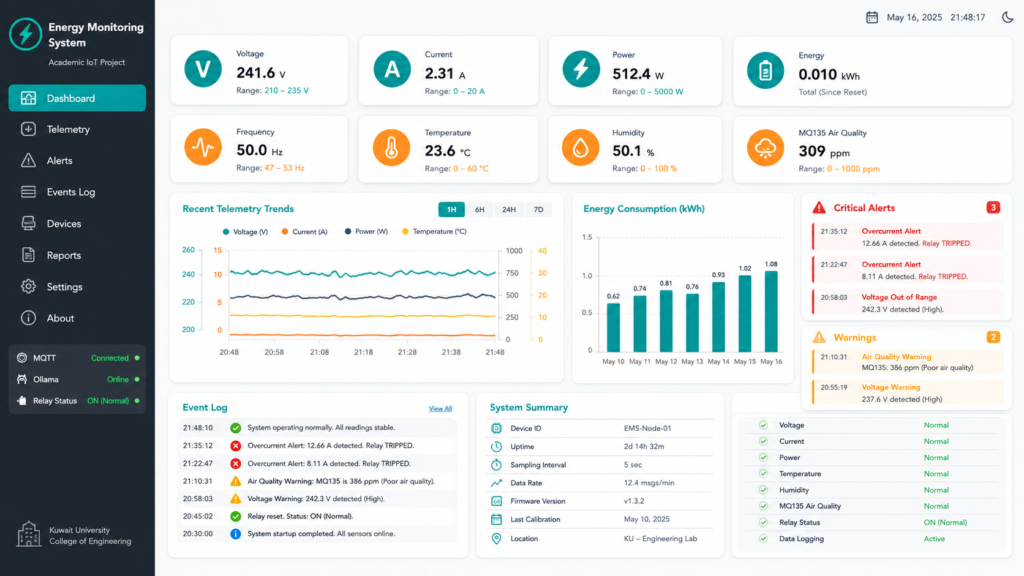
The reading of the MQ135 rose in the poor air quality experiment. The computer panel displayed warnings of poor or hazardous air quality. This helped to demonstrate the capability of the system to sense environmental changes and send alerts. The voltage experiment was conducted on the dashboard and it was found that the voltage was in the range of 237V to 243V. It was outside the range of 210-235V that the system had been selected for. This showed that the voltage warning rule was working.
In the overcurrent experiment, current readings were raised over 5 amperes such as 8.11 amperes and 12.66A. The system generated overcurrent warnings and relay trip status. This has verified that the safety logic could sense the high current situation and take action. The tests demonstrated that the Energy Flow Agent can measure the electricity and environmental values, sense abnormal conditions, alert the user and protectively act using relay control.
Problems May Face During Development
Like most embedded systems projects, this project may have several challenges. Some values may be zero at the start up. This may occur due to the need for sensors to be initiated. Wi-Fi stability also has a crucial role in MQTT communication. In a weak network, the data on the dashboard might be delayed.
There also needs to be careful testing of relay control. There are both active LOW and active HIGH relay modules. If students are unsure of the relay action, the load could be energised or de-energised in the opposite direction.
The other problem may be the calibration of the sensors. MQ135 values are dependent on the environment, sensor warm up time and calibration. The readings of DHT22 may also vary depending on the placement and airflow. Care must be taken with the wiring of a PZEM as it is measuring the electrical parameters.
The software setup of Flask and Ollama part also needs to be correct. Python must be installed, MQTT broker must be up and running, and Ollama must be running locally for AI analysis.
Frequently Asked Questions
What is the Energy Flow Agent project?
Energy Flow Agent is a smart energy monitoring system based on the ESP32, MQTT, PZEM-004T, DHT22, MQ135 sensor, relay module, Flask dashboard and Ollama AI. It records voltage, current, power, energy, frequency, temperature, humidity and air quality in real-time.
Will this project benefit the students of Kuwait?
Yes, the project is valuable for the Kuwait engineering students as it emphasizes on smart building energy monitoring, electricity safety, IoT communication, and analysis using AI. It can be particularly useful for students on embedded systems, IoT and smart automation projects.
In this project, what is the purpose of MQTT?
The transmission of real-time sensor data is done from the ESP32 to the dashboard using MQTT. The Flask bridge server receives data to be displayed and monitored in real-time from the ESP32 which publishes it to the MQTT topic.
What does the relay module do?
The relay module is used to control the electrical load. In this project, when the current exceeds the set safety limit, the ESP32 can switch the state of the relay to avoid the load from the unsafe state.
What does Ollama AI do?
The local intelligent analysis is conducted using Ollama AI. It can be used to help explain sensor readings, to detect abnormal conditions and to give simple recommendations to the user to recommend, for example, checking the voltage, lowering the load or increasing ventilation.
Will this project help save on electricity costs?
This project could be useful to helping the user become more aware of their electric consumption. Real-time tracking of energy use helps users gain insights into energy consumption and increases energy awareness. But real bill cuts will depend on the usage of the monitoring results.
Does this project require any special safety measures for direct installation in your home?
This project is an educational prototype and is not intended to be a certified electrical protection device. Switching to the AC mains voltage should be performed with appropriate precautions, insulation, fuses and circuit breakers and expert supervision.
Do I have full documentation and help with my project?
Yes. Please reach out to us via the Contact page for full documentation, circuit guidance, ESP32 code support, MQTT configuration, Flask dashboard setup, testing procedure and troubleshooting.
